Investing in research
The purpose of this note is to better understand the Barbell investment strategy in the fixed income ETFs universe. Our quantitative research falls within our efforts at Quantilia to identify the key drivers of our clients’ portfolios and to highlight interpretations of their decisions. To this end, we leverage the complementarity between the impartial point of view of artificial intelligence and the always subjective, yet indispensable human expertise.
Barbell Strategy
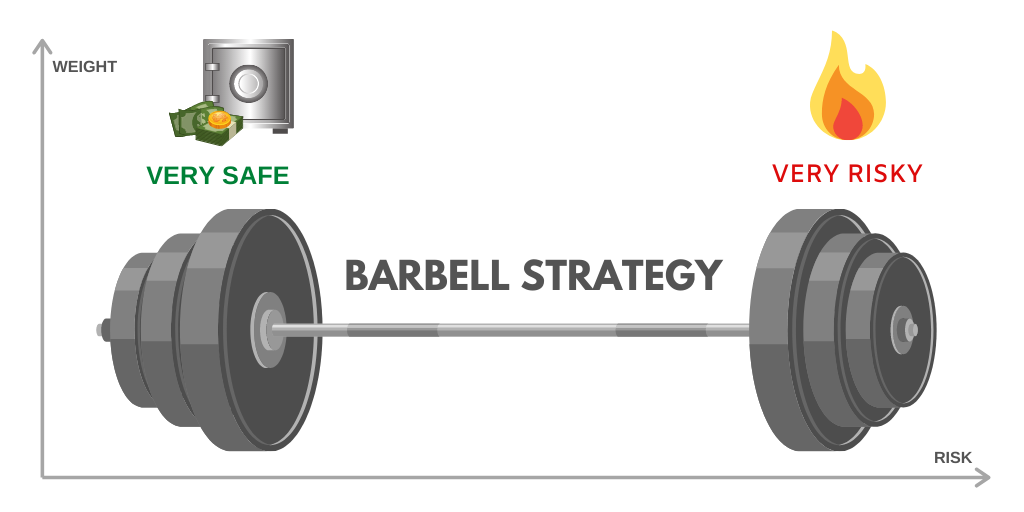
The Barbell strategy advises to invest in the two extremes, high risk and small risk investments, while excluding middle risk ones. In fixed income, it implies investing in both the short-term and long-term yields while avoiding the middle term of the yield curve. The long-term end is more volatile than the short-term counterparts. This approach purposely excludes intermediate-term bonds, betting that returns will be higher on the wings of the yield curve.
Jacques Lemoisson, Head of Global Macro & Alternative Investment at Compagnie Bancaire Helvétique, says:
“The Barbell strategy is also an alternative investment strategy allowing investors to hedge a risky long position with a long cheap tail risk position.
This arbitrage is counterintuitive for many investors but in NIRP/ZIRP environment investors have no choice to chase yield.
In this dangerous chase, investors go long durations or dive in low ratings. In few words, cheap hedges of tail risks generally offer huge leverage on the upside when the long risky assets are dropping. Usually, investors are more disposed to implement long-short, which in fact double the risk.”
The case of US treasuries
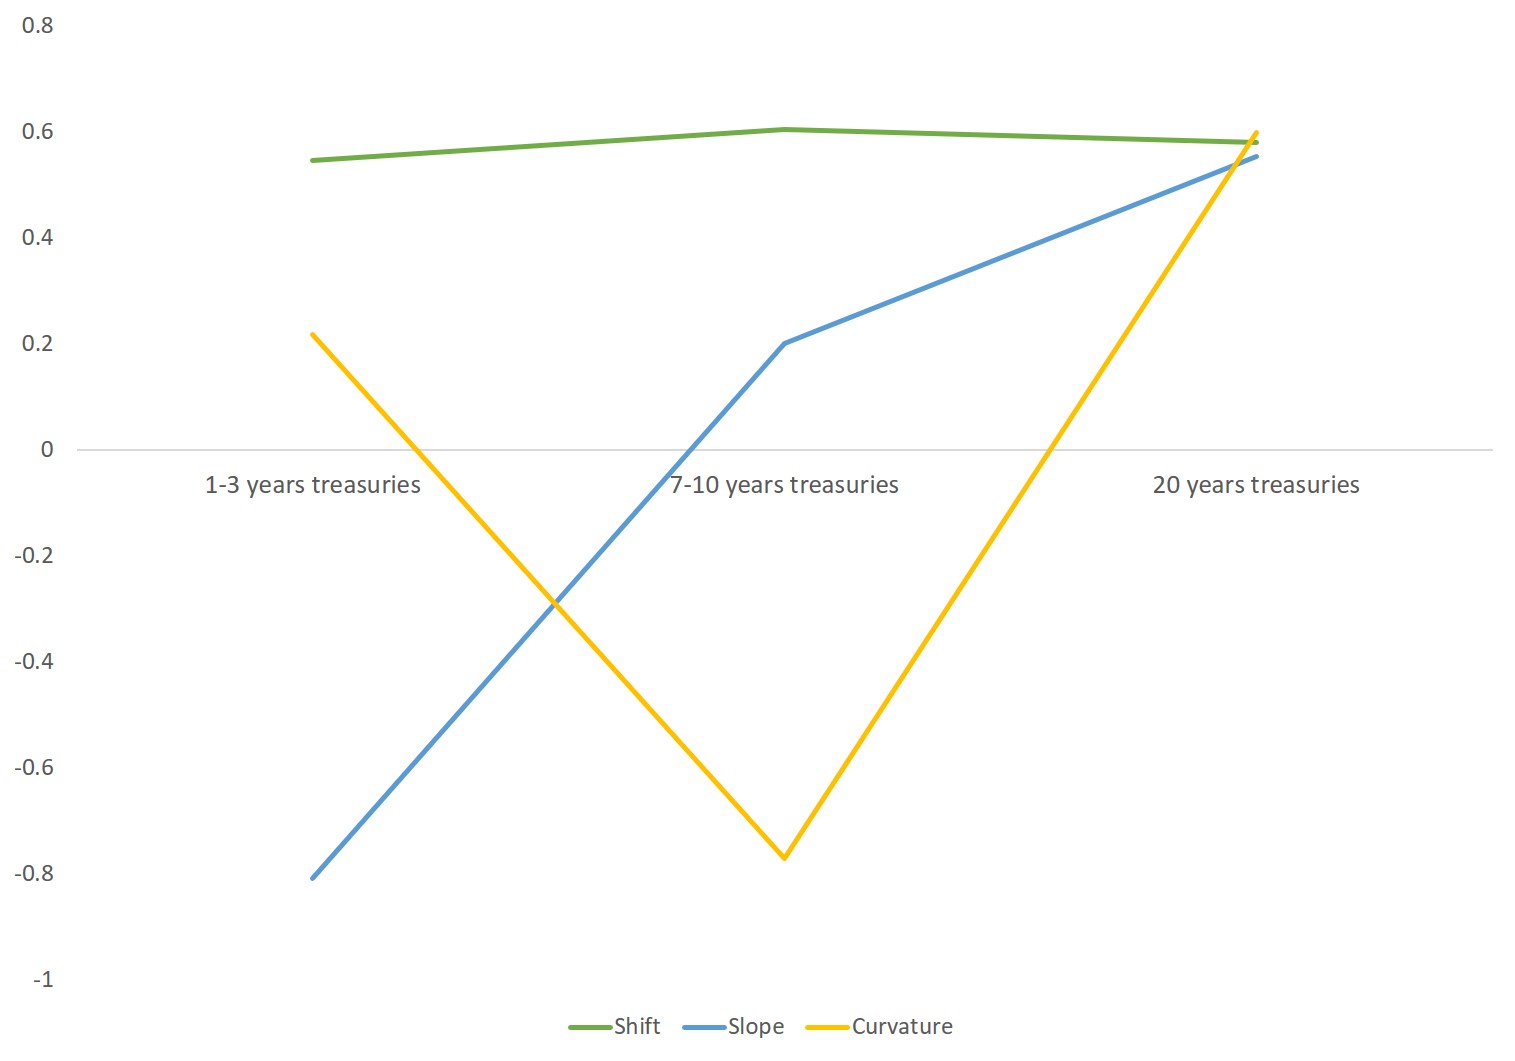
A spectral analysis run on the daily returns of the most liquid US treasuries ETFs (iShares 1- 3 Year Treasury Bond, iShares 7-10 Year Treasury Bond, iShares 20+ Year Treasury Bond) emphasizes the linear uncorrelatedness between three types of risks that can be read easily from the loadings (see Fig. 1):
- Parallel shift: the first eigenvector has approximately equal components, vertical translation : every point of the curve moves up or down.
- Slope: the second eigenvector has elements of increasing magnitude with opposite signs at the end points of the maturity range. It stands for steepening of the yield curve (long-term yields are rising much faster than the yields on the short-term) or the flattening·
- Curvature: the third eigenvector has components first decreasing then increasing, approximately equal at the end points of the maturity range and of the opposite sign in the middle. Intuitively, the curvature is the amount by which a curve deviates from being a straight line
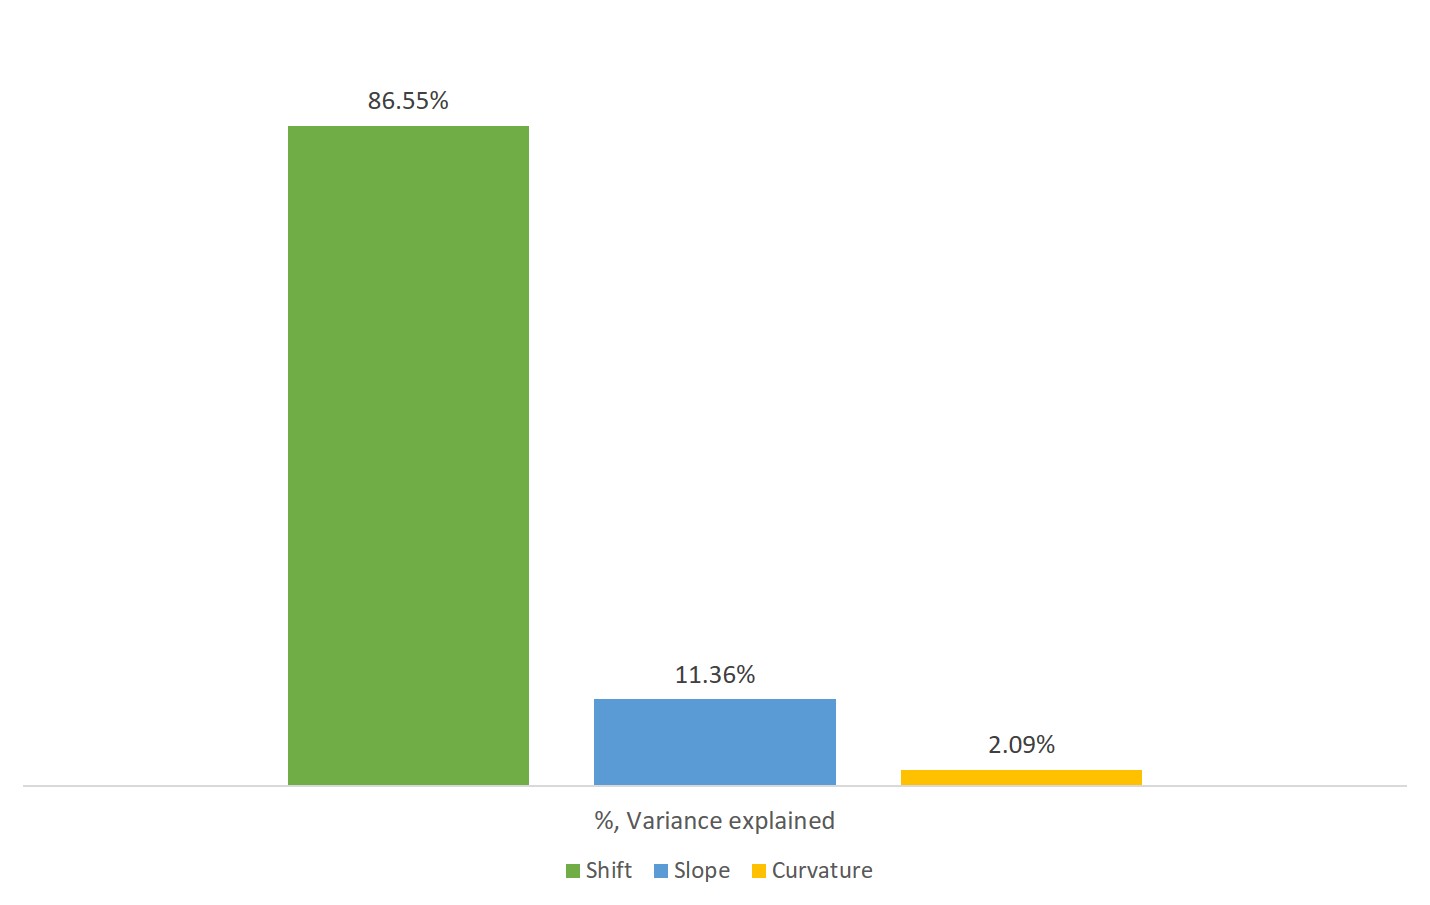
Theory says that the principal components are (linearly) uncorrelated. The variance of the universe returns spreads 84% along the shift, 14% along the slope, 2% along the curvature (see Fig. 2).
From here, we can build three orthogonal strategies, each one standing for one of the yield curve moves.
Those three strategies are monthly rebalanced by the loadings:
- the first one is an equal-weight basket of the three ETFs;
- the second one is long the long-term, short the short-term strategy;
- the last one is the Barbell strategy (i.e. long both short and long term, short the medium-term).
In addition, the three strategies are volatility-controlled so that for each date, returns with similar volatility are compared.
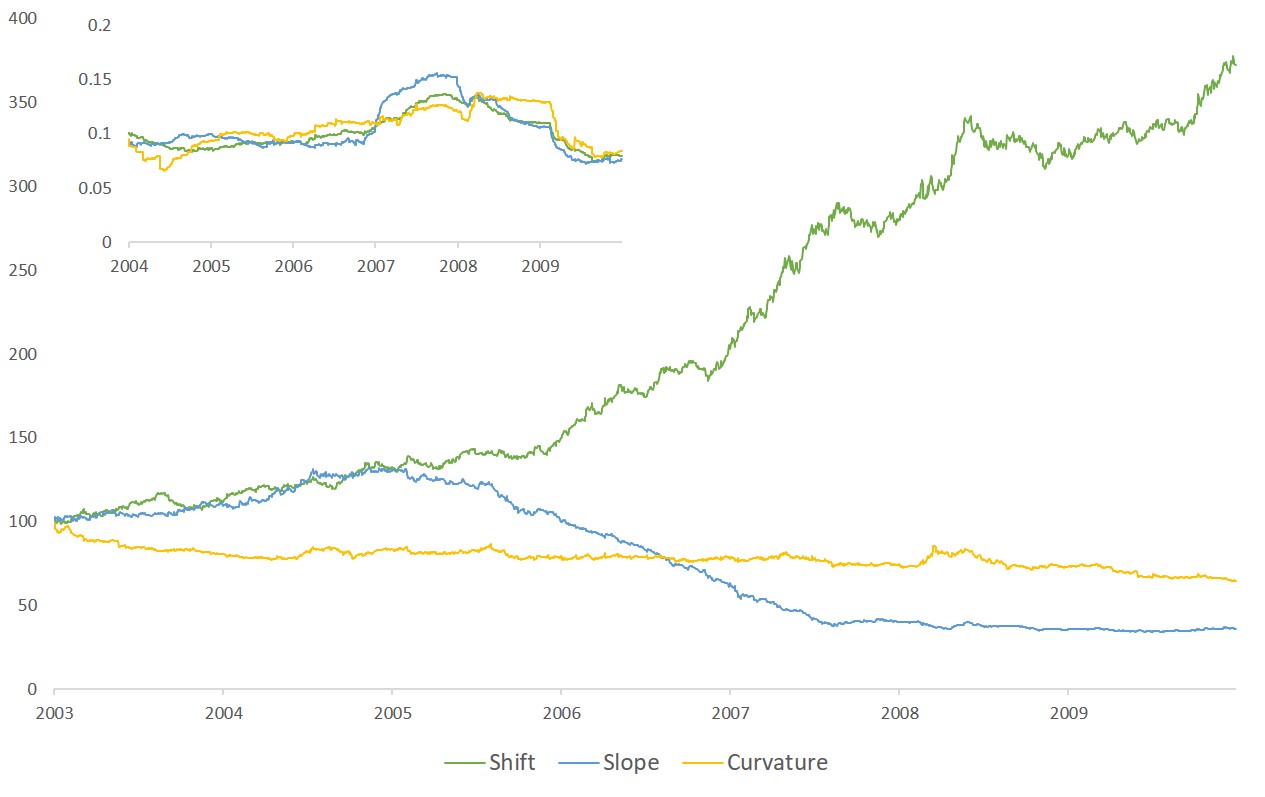
Inset: One year rolling volatilities highlight that strategies’ risks are of the same order of magnitude
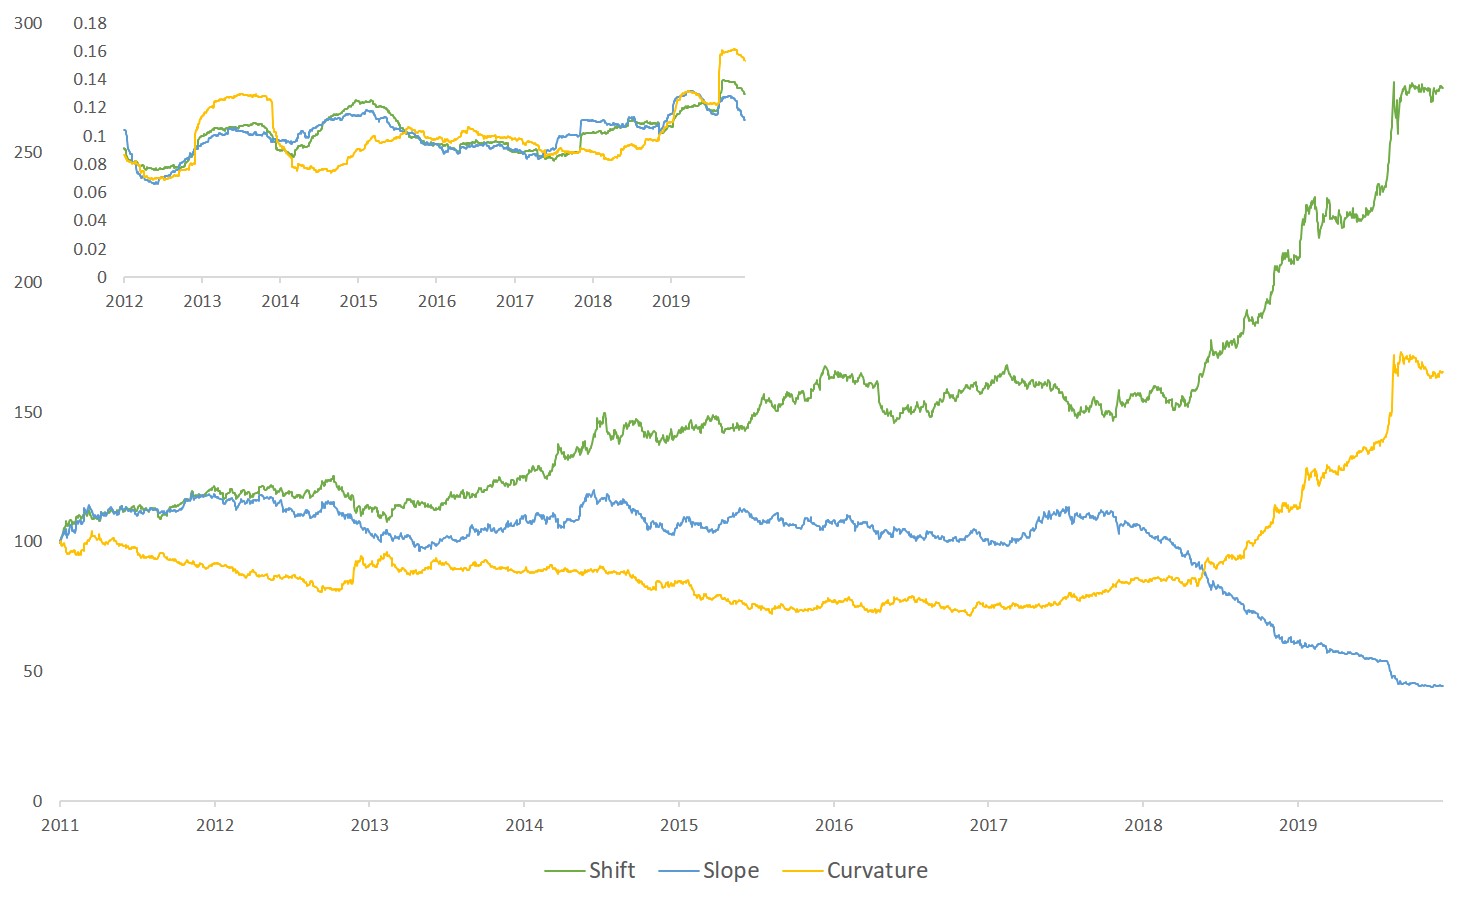
Inset: One year rolling volatilities highlight that strategies’ risks are of the same order of magnitude
The problem becomes more complex when using corporate bonds ETFs, or even aggregate ETFs, as it brings multifold risks: yield curve risk, credit risk, mortgage risk, geographic risk etc.
The coincidence between the proliferation of instruments and the rising correlations between those instruments in bad times suggests the existence of underlying overlapping factors.
A case study
We shed new light on this question by focusing on the disentanglement of risk premia in the USD fixed income markets and open the discussion on the issue of diversification. Large shocks in portfolios are typically driven by correlated (and hence collective) moves of their constituents. We leverage our factor module to unveil separate risks from relatively orthogonal factors. This will enable us to distinguish genuine characteristics of the portfolio.
We purposely designed a slightly more nuanced strategy in terms of diversification. In order to better match the complexity of a real-world allocation of ETFs, we use a short-end high yield ETFs which aims at diversifying the risk of a long-term government ETFs.
Constituents:
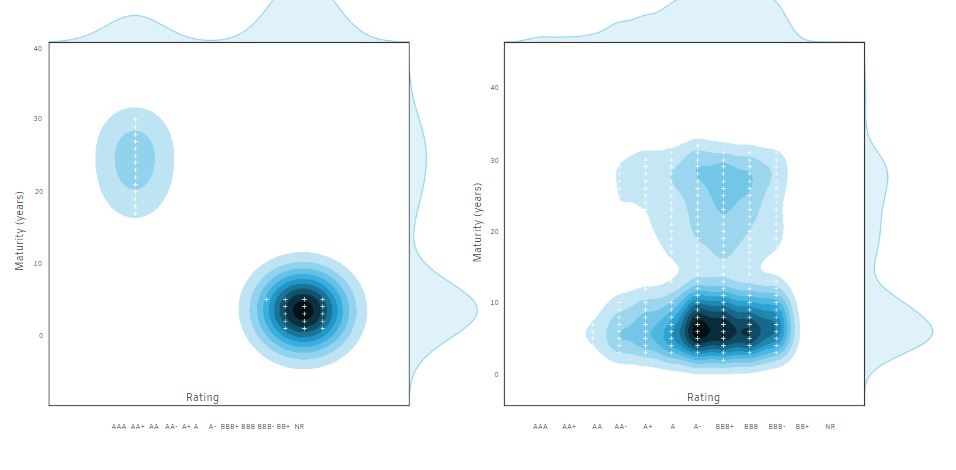
Our factor module works as follows: each premium is considered and is linearly hedged (via a rolling regression) from the previous premium. It starts from the 10-year treasury bonds, the 20Y-10Y bonds follow,then the USD IG bonds, the USD HY bonds and finally the mortgage bonds follow.
The aim is to separate risks from relatively orthogonal factors, that are easily interpretable (IG, GY, curve etc.) contrary to usual principal components study and easy to invest in (the exposure do not change too much over time which would imply a lot of rebalancing).
More importantly, the analysis is holistic in that the factors cover the whole USD bonds market explaining more than 97% of the variation of US Aggregate ETFs.
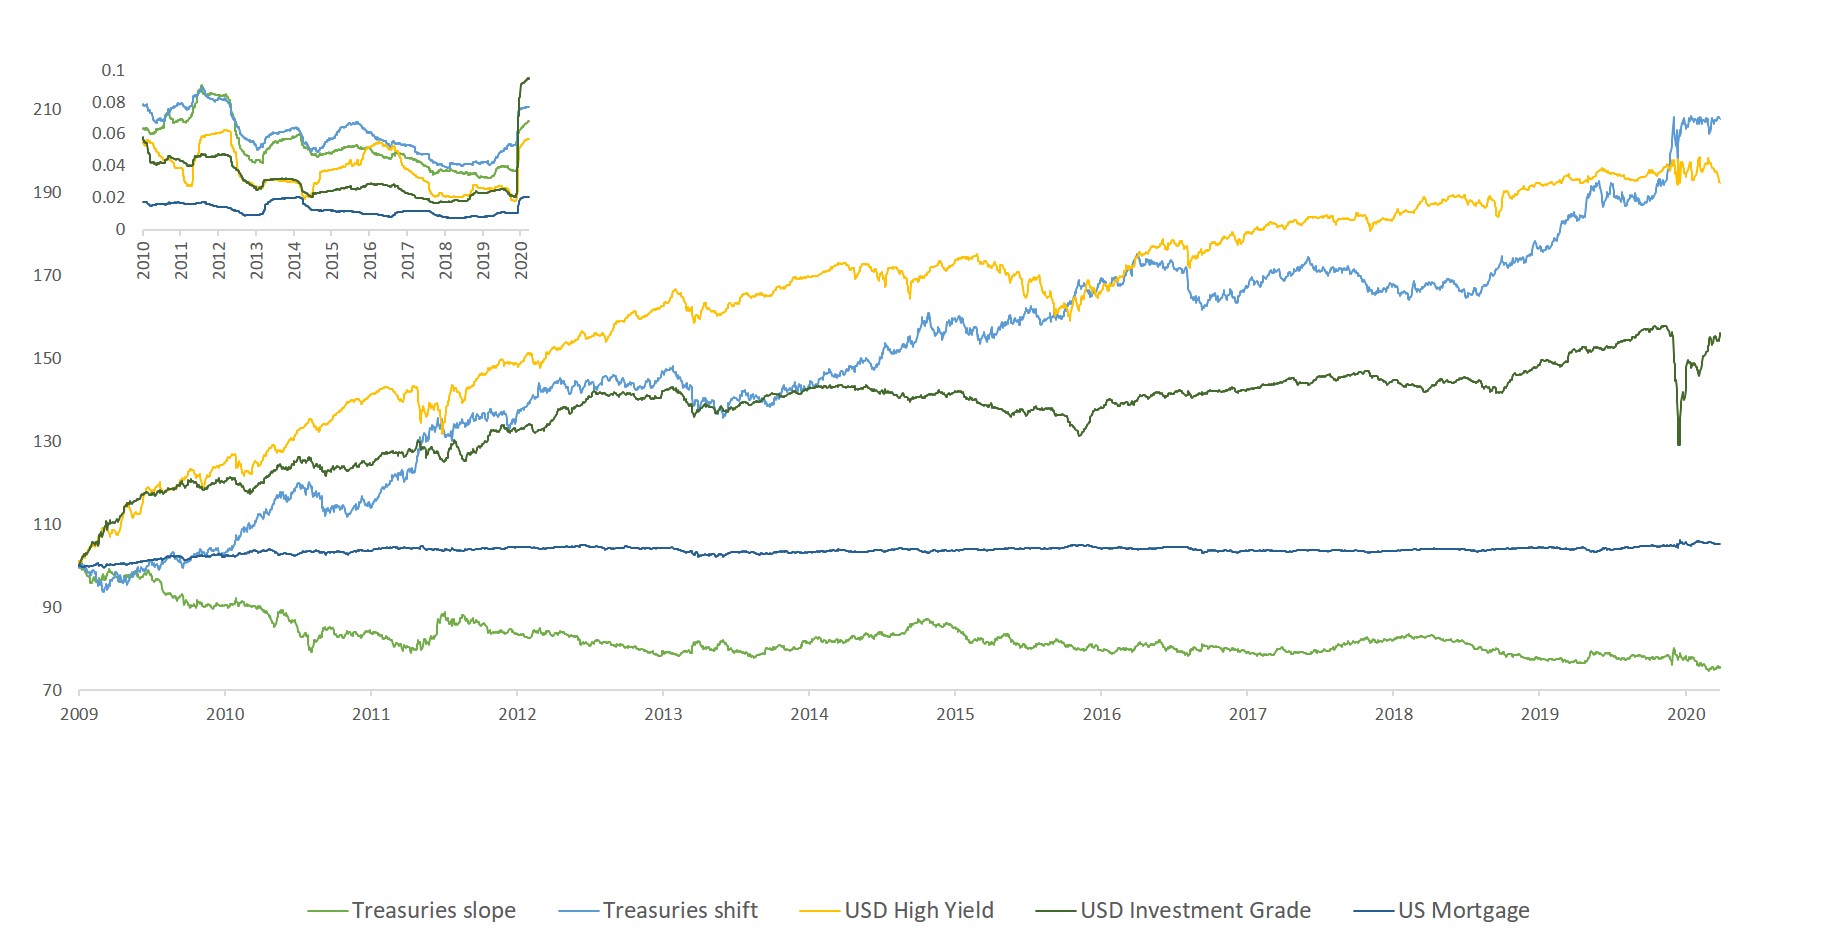
Zoom on the last 2 years :
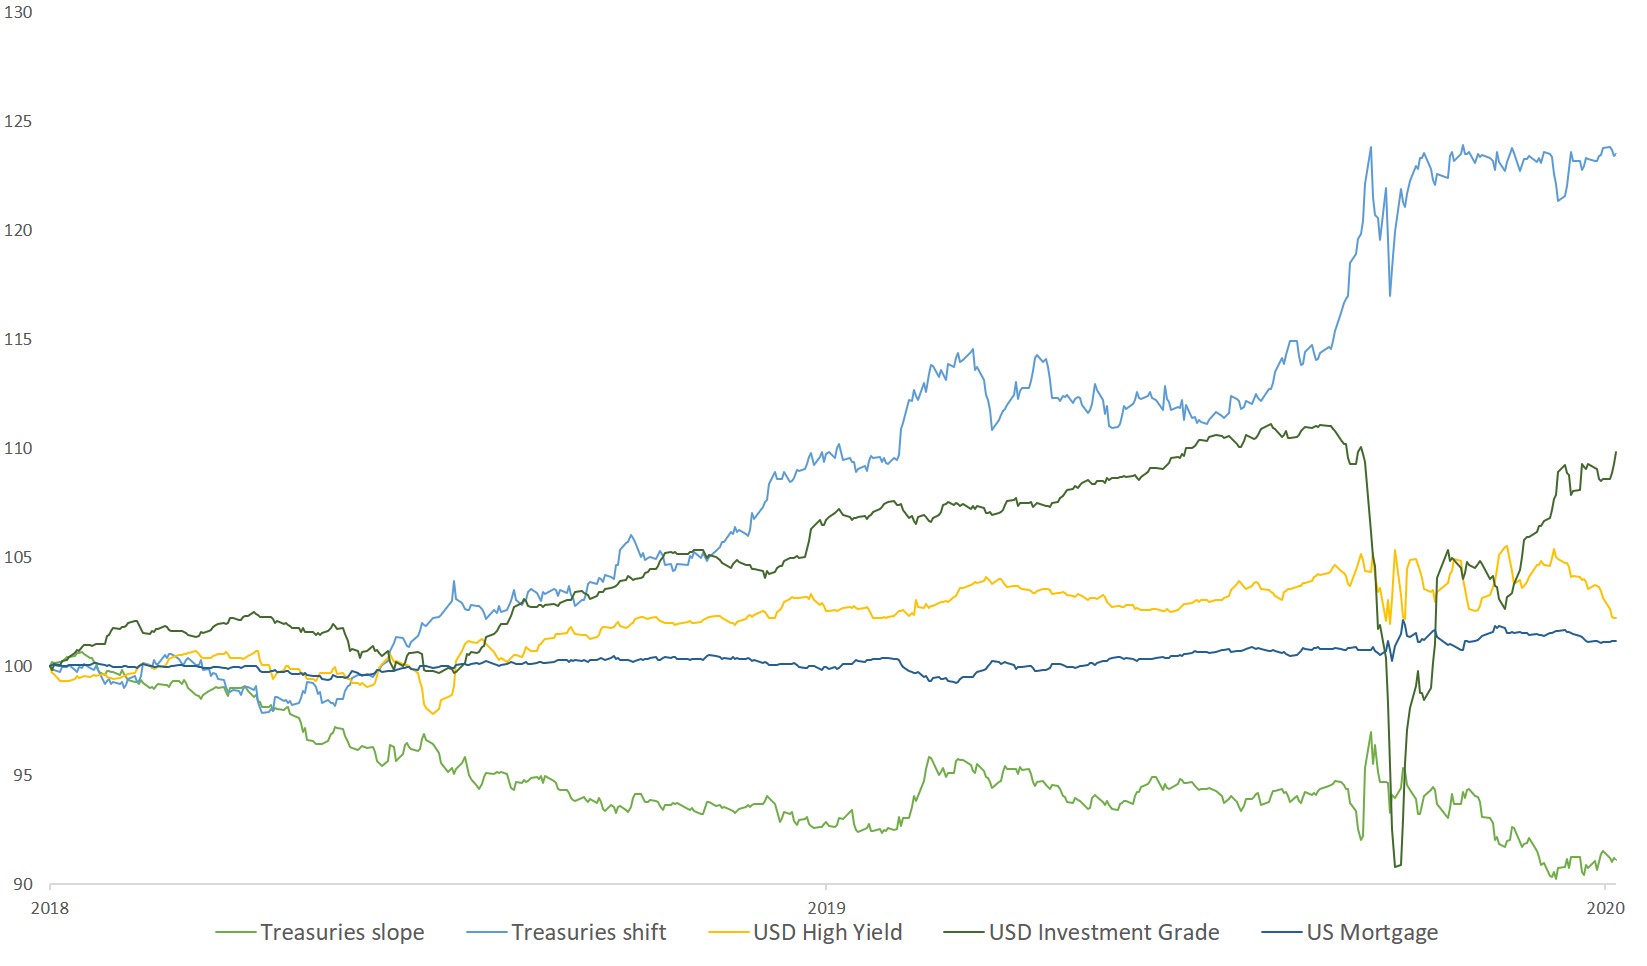
Our factor module works as follows: each premium is considered and is linearly hedged (via a rolling regression) from the previous premium. It starts from the 10-year treasury bonds, the 20Y-10Y follows, then the USD IG bonds, the USD HY bonds and finally the mortgage bonds.
The aim is to separate risk from relatively orthogonal factors, that are easily interpretable (IG, GY, curve etc contrary to usual principal components study and easy to invest in (the exposure do not change too much over time which would imply a lot of rebalancing).
More importantly, the analysis is holistic in that the factors cover the whole USD bonds markets as it allows to explain more than 99% of the variation of US Aggregate ETF.
Throwing new light on multifold risks:
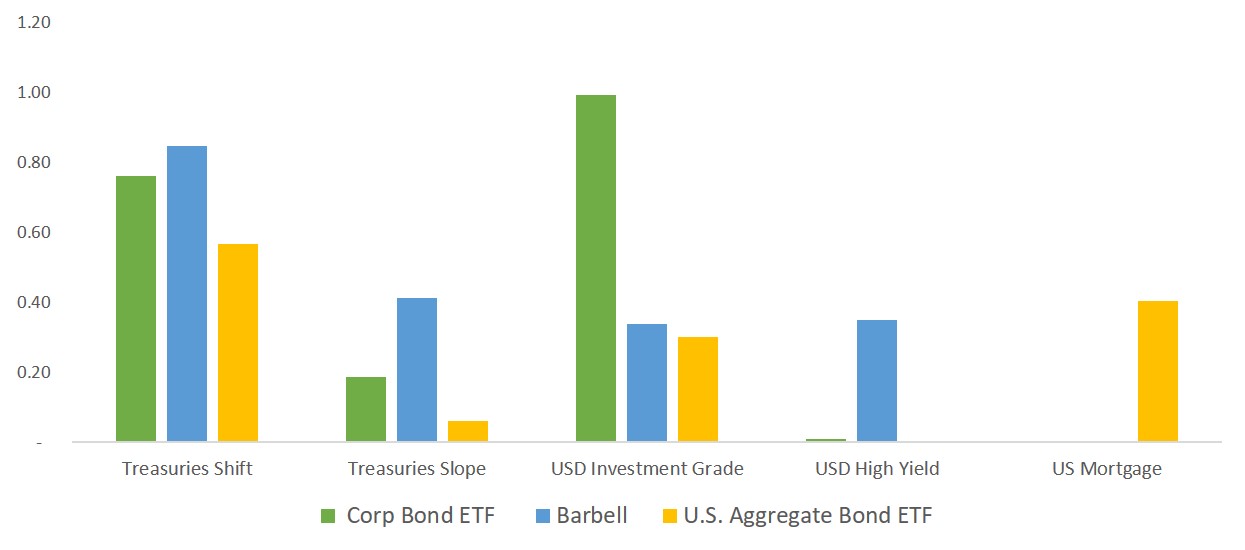
We can read a clear-cut breakdown. The exposure on the treasury shift are comparable except for the U.S. Aggregate as it has a relatively smaller duration. The Barbell strategy is significatively more exposed to the slope factors than its peers as it excludes the medium-term bonds.
While exposures on investment grade of the Barbell and U.S. Aggregate are comparable, the Corporate Bond ETF is naturally exposed to it. As expected, our Barbell strategy is the only one that loads on high yield: the others are statistically insignificant, plus we retrieve the noticeable exposure of the U.S. Aggregate on mortgage bonds.
An example of the 2 years performance and risk contributions follows:
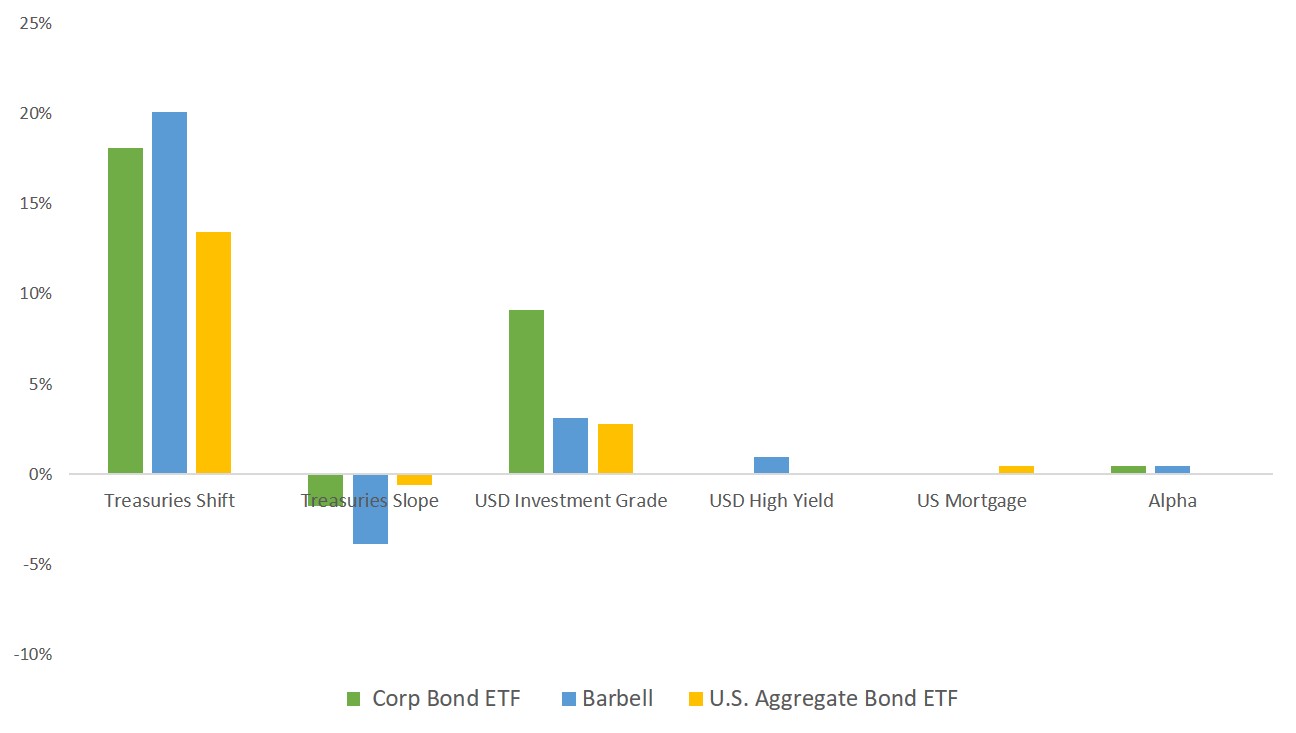
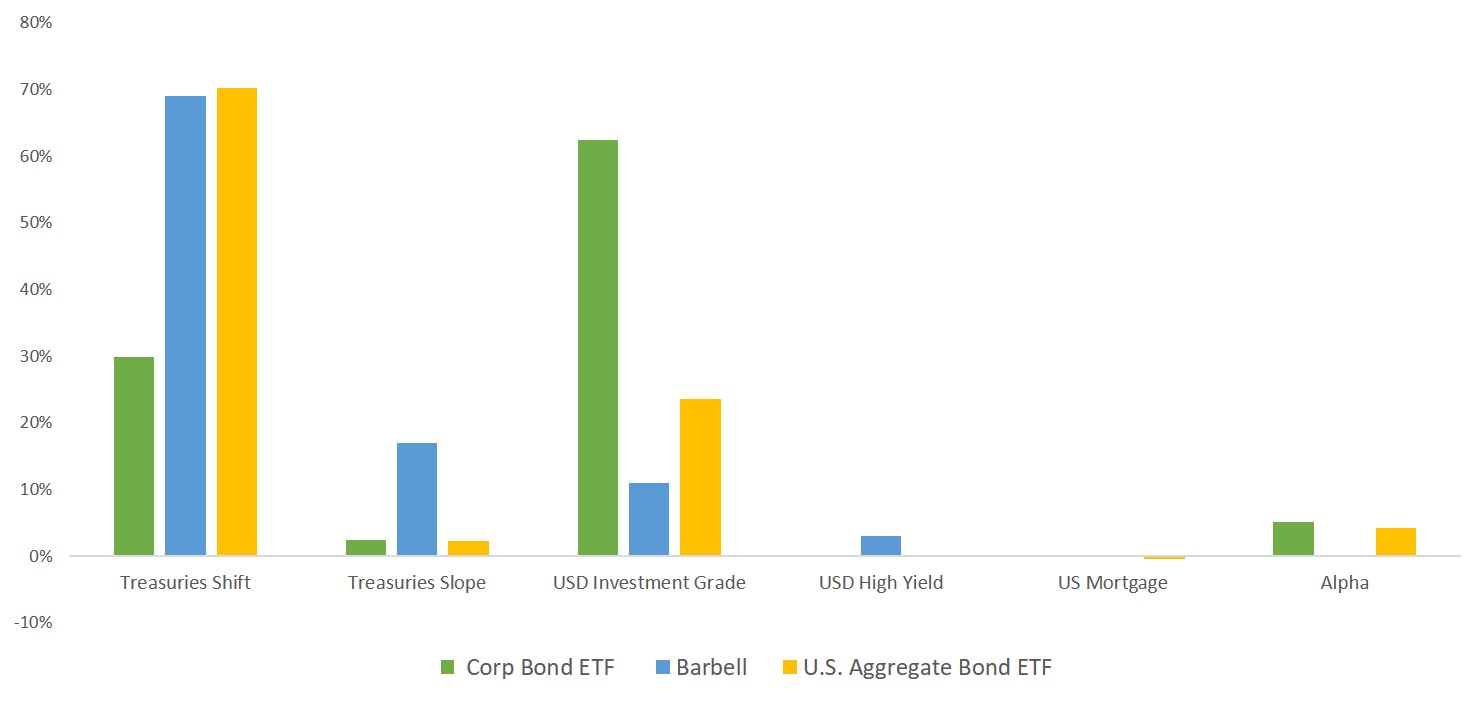
Examining portfolios through risk factors unveils a consolidated and unambiguous view of fixed income ETFs. It disentangles overlapping sources of risk across multiple investment themes – which is salutary with dozens of investment lines – and narrows them down to concise and reliable factors which drive the majority of risk (R² are higher than 99%, exposures are heavily autocorrelated and are relatively stable during the Covid turmoil).
In addition, these risk factors can easily be matched with economic intuitions.
In contrast, PCA or machine learning techniques are ineffective by themselves to build interpretable and investable factors, making sources of risk less identifiable. It is part and parcel of our approach to build a fruitful collaboration between quantitative research and human expertise.
Jacques Lemoisson, Head of Global Macro & Alternative Investment at Compagnie Bancaire Helvétique, says:
“The first step is to identify where are located tail risk. This step is identical to the curve Barbell strategy expose in the first paragraph. The central bank policies are building days by days two major tail risks in: Volatility and rate hikes due to the massive downgrade or an unexpected rise of the inflation or a U-turn in the monetary policy. All initiate a violent move in the related assets. The extreme of the spectrum consists of Treasuries and High Yield, with the volatility as a third dimension.
Central bank policies have massively (and artificially) dragged down the volatility, yields and spreads. One of my favorite Barbell strategy is to initiate in parallel a long position in High Yield and Treasuries of the same duration. Another, very useful trade is to be long High Yield and long MOVE(Treasury Volatility).
In the current environment, Central Banks are full steam, buying mostly high rated assets by hundreds of billion. The sole case when a long/short position is interesting in a Barbell strategy when I anticipate a sharp rise of the correlation. Excepted volatility, all the spectrum of bonds will drop in value.”


