Investing in research
The rationale for this note is part of Quantilia’s aim to better model the dependence structures of financial instruments. Non-linear behaviour will be addressed in another publication.
Our quantitative research falls within our efforts at Quantilia to identify the key drivers of our clients’ portfolios and to highlight interpretations of their decisions. We aim at unveiling the deep interplay between instruments without falling into the drawbacks of classical selection and allocation analysis – which proved unable to overcome diversification issues, as past financial crises have shown.
To this end, we leverage the complementarity between the impartial point of view of artificial intelligence and the always subjective, yet indispensable human expertise. When carefully combined, artificial intelligence and human intelligence can lead to robust decision-making. The following study is illustrative of our approach based on fruitful collaboration between artificial and human intelligence in financial research.
Dimensionality reduction and the curse of dimensionality
To unfold the linear relationships between assets, both practitioners and academic literature generally use the linear correlation matrix. Yet most machine learning algorithms suffer from the curse of dimensionality: this issue arises when the number of variables increases dramatically compared to the number of observations. Those matrices can even be pathological.
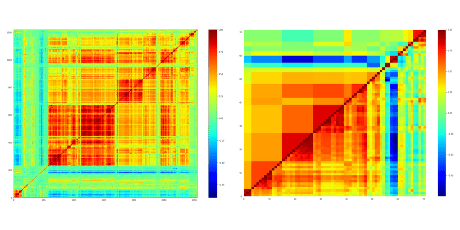
For instance, when we study 1200 instruments (a collection of ETFs, Funds and indices: risk premia or regular premia) on a standard window that is 3 years, the number of features – i.e. 1200 – exceeds the number of observations – i.e. 3*250 = 750. Therefore, the diagonalization will show 1200 – 750 = 450 null eigenvalues. A random permutation of ordering of the correlation matrix exemplifies the estimator noisiness. Typically, the result of this is a weak signal-to-noise ratio:

However, reordering the correlation matrix unveils a complex structure of non-diagonal blocks and the subtle interplay between strategies:


This multifold structure can be leveraged to filter the correlation matrix and highlight relatively homogeneous subgroups of strategies that are closely intertwined.

Given its importance, correlation matrix filtering has a long history dating back to 1999 (R. N. Mantegna, The European Physical Journal B Condensed Matter and Complex Systems 11, 193).
It is a dimensionality reduction technique which allows us at Quantilia to identify and better understand the sources of systematic risks.
As a result, we manage to reduce risks to a parsimonious number of key drivers which explain most variations in the returns of our clients’ portfolios.
Subjective criteria for grouping elements may be asset class, provider, country, sector, or other considerations based on human activity. Such clusters neglect possibly crucial information held by the correlation matrix, and a substantial part of the structure is lost by breaking it down into arbitrary features. At best, this method may only confirm what we are already able to hypothesize, but it cannot reveal relevant clustering criteria that we did not suspect in advance.
Instead, machine learning techniques unfold and capture some of the structure while retaining information erased out by subjective clustering. Even when the asset class is decided in a subjective way, not to say by arbitrary choice, concurrent groupings of equity ETFs appeared: by country, sector, style etc.
The length of the available time series is very short compared to the number of assets which entails that the correlation matrix is ill-conditioned and thus suffers from significant biais. An opposite issue of the sample size problem is the non-stationarity of correlations.
Structural breaks make correlations fluctuate significantly to such a degree that for now, no reliable maths model can explain those unpredictable discontinuities, whether exogeneous or endogenous. The stocks-bonds correlation is a striking example of such turnarounds: in the late 1990s, its sign changed from positive to negative. Although those occurrences are unforeseeable, a prominent part of the sophisticated non-diagonal structure of the correlation matrix persists through structural breaks. We witness consistency of the grouping on non-overlapping windows.
As correlations play a crucial rule in risk management, it is of utmost importance to filter the correlation matrix in such a way that the persisting structure is preserved. We shall discuss how stable hierarchical structures may be when using bootstrap techniques in another paper. The topic of this paper will be part of the broader issue of correlation matrix filtration for the purpose of portfolio optimization.
A case study
A client has a universe of 71 ETFs. We apply the correlation matrix filtering to this universe.


To study a universe of 71 ETFs across several asset classes, we apply our clustering technique to deal with the problem of high correlation among independent variables. Not only does our methodology allow to reduce the dimensionality of the problem, it also allows to filter the correlation matrix, unveiling a complex dependence structure of non-diagonal blocks.
The rationale is to classify ETFs into similar clusters and then choose their representatives so as to remove redundant ETFs. For instance, our methodology allows to bind short equity and volatility ETFs together, but it will not explain in any way the structural break of the stocks-bonds correlation or gold-stocks correlation.
The incentive is threefold:
- It removes repetitive information while preserving the non-stationary part of the correlation;
- It sensitizes portfolio managers to collinearity which appears within the same cluster (i.e. ETFs that are driven by the same underlying risk);
- Last but not least, clusters can easily be interpreted, narrowing down the high-dimensional allocation problem to a human-scale set of ETFs with economic intuitions.
In order to replicate most of the performance of the devised portfolio, we leverage, once again, the complementarity between AI and human expertise to handle the tradeoff between an imprecise low dimensional problem and an unmanageable high dimensional problem – i.e. zooming in or zooming out of the filtered correlation matrix.