Knowing what you really hold, line by line, across all your funds: that is the promise of multi-asset look-through. For institutional investors, it is no longer a one-off regulatory exercise. It is a condition for deciding fast and being accountable.
Institutional investors rarely hold their assets directly. They hold them through funds: listed funds, private equity funds, private debt funds, funds of funds. Each layer adds a manager, a reporting format and a timetable.
The result: to the simplest question, “what is our real exposure to this company, sector or country?”, many teams answer in days, sometimes weeks.
“When something happens, teams come under heavy pressure to measure their exposure to a given asset within hours. But you can only answer if a robust look-through has been prepared beforehand: otherwise, the data simply isn’t there.” — Florian Garivier, CEO, Quantilia
This article explains what look-through is, why it must cover every asset class, and how to set it up without overhauling your systems.
What is look-through?
Look-through means looking through the funds you hold to reach the underlying assets: equities, bonds, loans, private companies, real assets. The portfolio is no longer a list of funds, but the full set of lines actually held, with their issuer, sector, country and weight.
In practice, look-through takes three steps:
- Collect each fund’s holdings from managers, custodians and banks, in their original formats.
- Check those holdings: consistent amounts, reporting dates, duplicates, missing lines.
- Consolidate every line into a single dataset, to analyse it by issuer, sector, country or asset class.

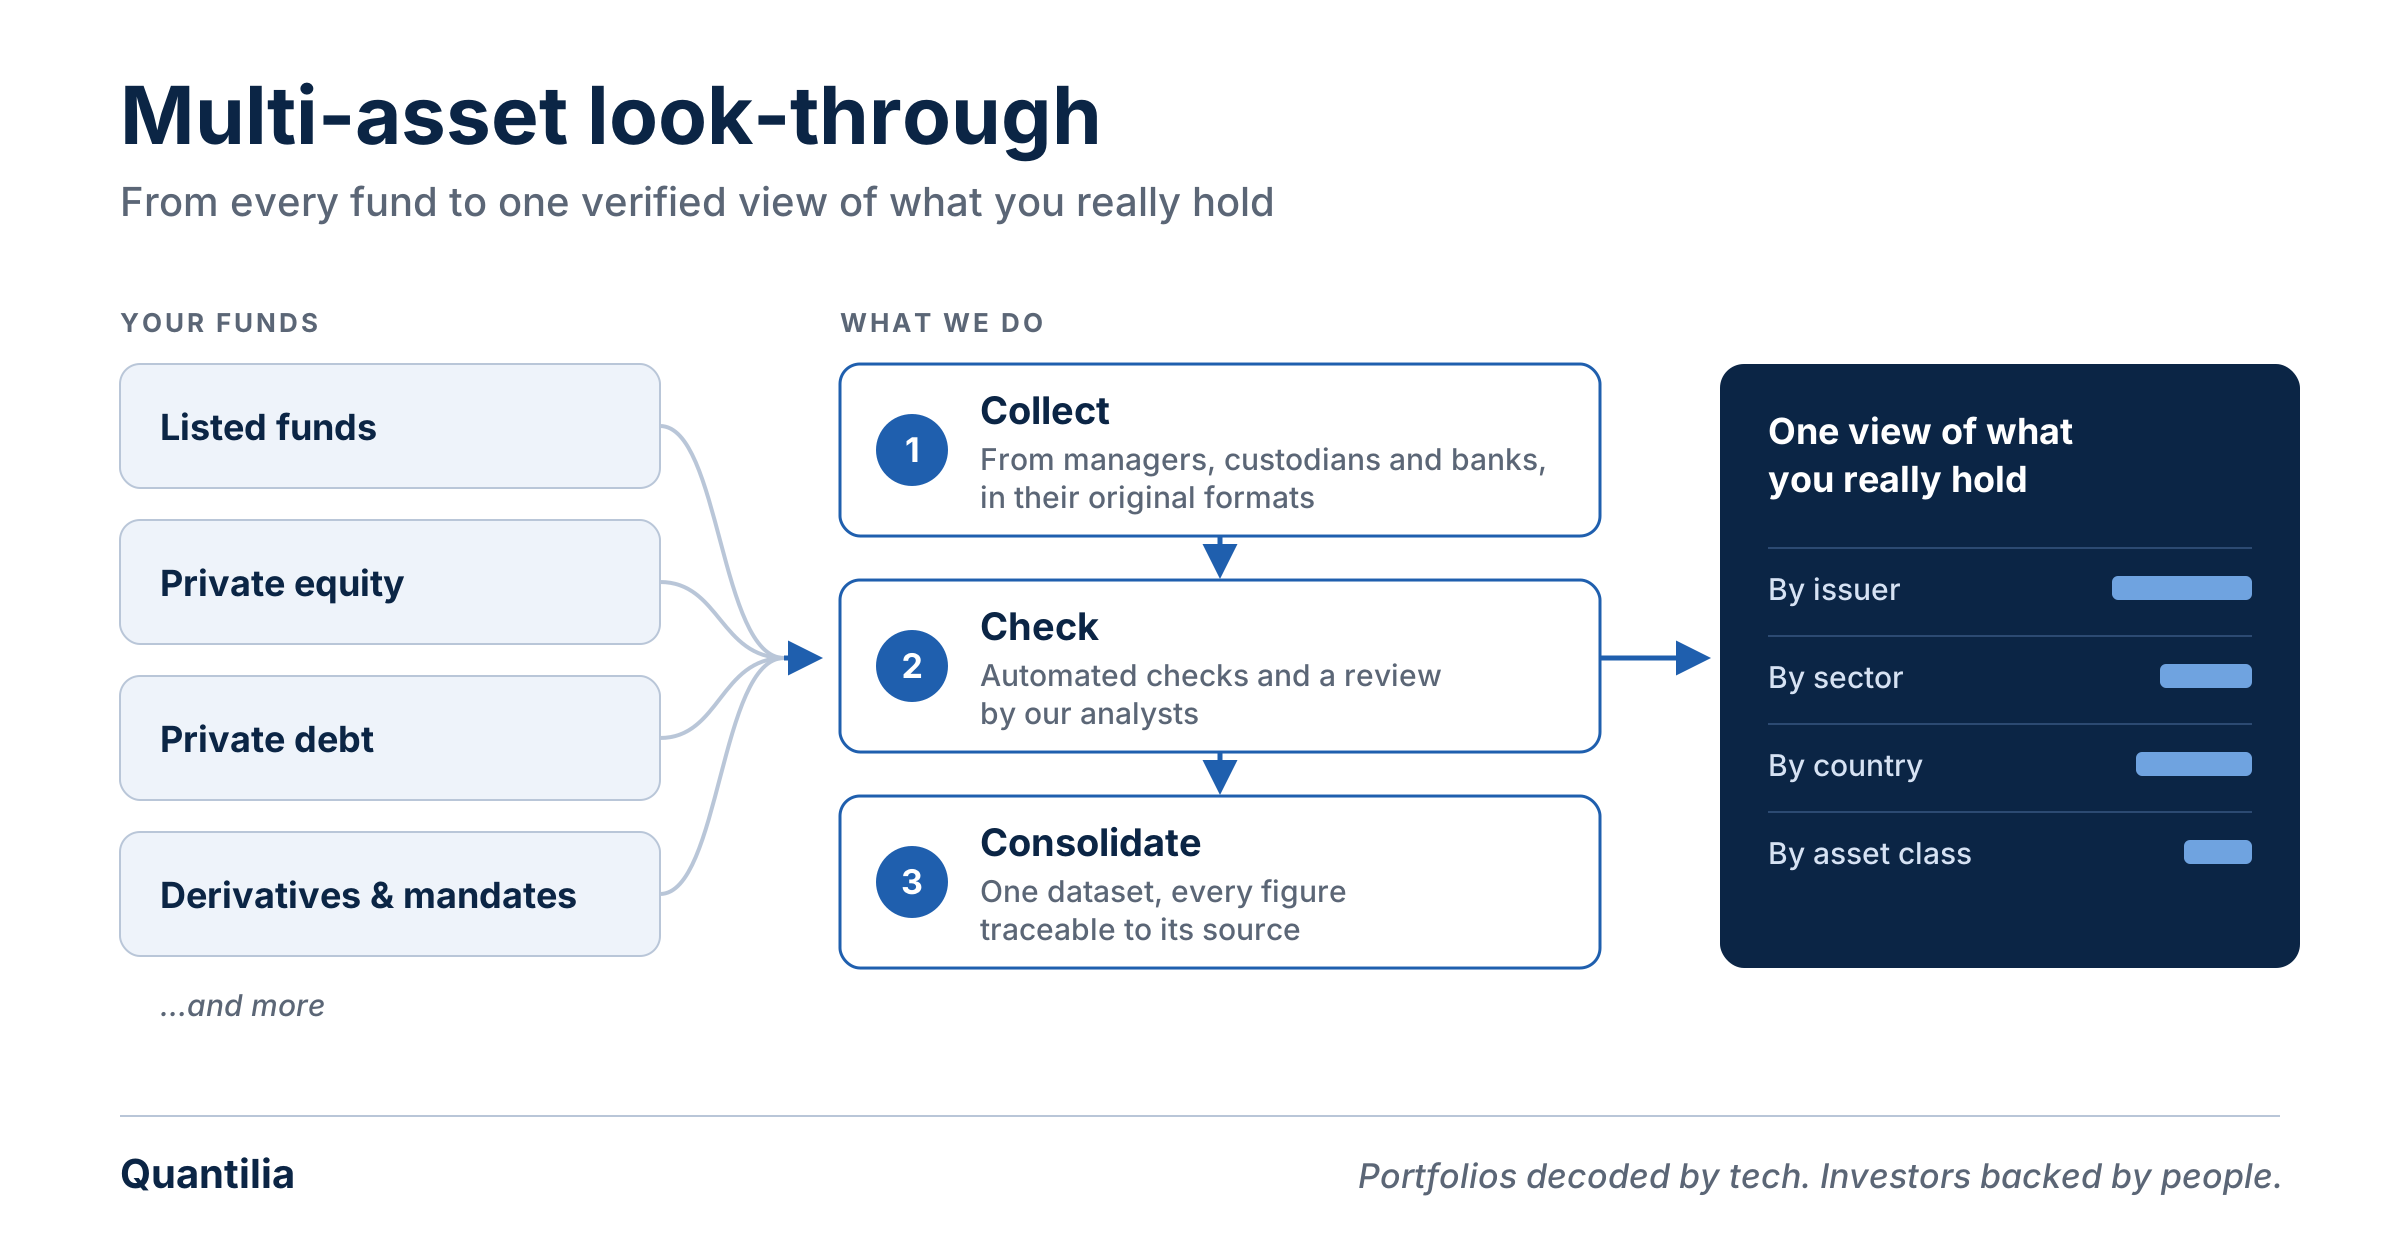
The hard part is almost never the calculation. It is collection and checking: getting up-to-date, complete and consistent data from dozens or hundreds of different sources.
Why fund managers’ reports are not enough
Each manager produces a good report for its own fund. The problem starts when you put them side by side.
- Different formats. A structured file for a listed fund, a 60-page PDF for a private equity fund, a home-made spreadsheet for a private debt fund.
- Different dates. A listed fund publishes its holdings monthly, a private equity fund quarterly, often several weeks after the reporting date.
- Different definitions. The same issuer can appear under several names, the same sector under several classifications.
- No overall view. No manager sees the other funds in the portfolio: total exposure to an issuer held through several funds appears nowhere.
Putting these reports together by hand in a spreadsheet works while the portfolio stays small. Beyond a few dozen funds, consolidation takes weeks, every figure becomes hard to justify, and the result is already out of date.
Why look-through must be multi-asset
Look-through limited to listed funds leaves a growing share of portfolios in the dark. Institutional investors have sharply increased their allocations to private equity, private debt and real assets: precisely the least transparent pockets.
The reverse is also true: looking through private equity alone says nothing about total exposure. The same company can be held as equity through a listed fund, as debt through a private debt fund, and as capital through a private equity fund.
Only look-through that covers every asset class, in a single dataset, answers the question “what do we really hold?”. Private equity is often the entry point, because that is where the need is felt most. But the goal remains a complete view.
Quantilia looks through an institutional portfolio as a whole: listed funds, private equity, private debt, derivatives, mandates and more.
The questions look-through answers
February 2022: within 48 hours, every risk committee asked the same question, “what is our exposure to Russia?”. Teams with a look-through view answered the same day. The others had to write to each manager and wait.
An up-to-date look-through view answers five families of questions:
- Exposure and concentration: what is our total exposure to an issuer, sector or country, across all asset classes? Are we within our limits?
- Regulatory requirements: for an insurer, the Solvency II SCR calculation and QRT reports rely on looking through funds; a fund that is not looked through carries a heavier capital charge.
- ESG and climate: SFDR indicators, carbon footprint and national requirements such as France’s Article 29, all calculated on the underlying assets.
- Steering and reporting: board and investment committee reports based on what is actually held, not on a list of funds.
- Accountability: being able to justify every figure to an auditor, a regulator or a board, by tracing it back to its source.
How to set up multi-asset look-through in five steps
A look-through project rarely succeeds through a full overhaul. It succeeds by starting from what exists and widening step by step.
- Define the first scope. One asset class, one group of funds or one specific use (a regulatory report, a board report). Widen later, at your own pace.
- Map the sources. For each fund: who produces the holdings (manager, custodian, bank), in what format, how often, with what delay.
- Organise collection. This is the most underestimated step: getting the files, chasing late managers, handling format changes. It should start from what managers and banks already produce, without imposing a new format on them.
- Check every file. Automated checks (amounts, dates, consistency across sources) backed by a human review, so every figure stays traceable to its source.
- Deliver into your own tools. Look-through data is only valuable if it arrives where teams work: their existing tools and reporting templates.
Allow 4 to 12 weeks for a first deployment, depending on the number of funds and sources.
Build it or outsource it? The decisive question is not the software, but who collects, chases and checks, every month or quarter, without interruption. That ongoing workload is what makes most in-house projects fail.
An example: a €35bn pension fund
This pension fund held 150 funds, managed by 45 asset managers. Its reporting took up 35% of the time of 4 people.
| Before | After | |
|---|---|---|
| Reporting workload | 35% of the time of 4 people | 2 days a month |
| Funds looked through | Partial | 100% of funds |
| Reporting frequency | Quarterly or less | Monthly |
Deployment took 14 weeks, with no system overhaul: the fund kept receiving its data in its own tools.
Frequently asked questions
Is look-through only for private equity? No. Private equity is often where the need is most pressing, but real exposure can only be measured by looking through every asset class in the portfolio: listed funds, private equity, private debt, derivatives, mandates and more.
Is look-through mandatory? For insurers under Solvency II, it drives the SCR calculation: a fund that is not looked through can carry a heavier capital charge. For other investors, it has become a de facto requirement for risk management, ESG and accountability.
Can private equity funds be looked through? Yes, from managers’ quarterly reports. The challenge is extracting and checking data often delivered as PDFs, several weeks after the reporting date.
How long does it take to set up? Generally 4 to 12 weeks for a first scope, depending on the number of funds and sources.
Do we need to change our systems? No. Well-designed look-through starts from the files managers and banks already produce, and delivers the data into your own tools and reporting templates.
Go further
50+ institutional investors and family offices in 6 countries rely on Quantilia to analyse €250bn of assets from 800+ data sources.
- Watch the webinar “From PE Quarterly Reports to a Single Dataset”
- Download the guide “One fund portfolio, different levels of detail”
- Book a demo
Portfolios decoded by tech. Investors backed by people.